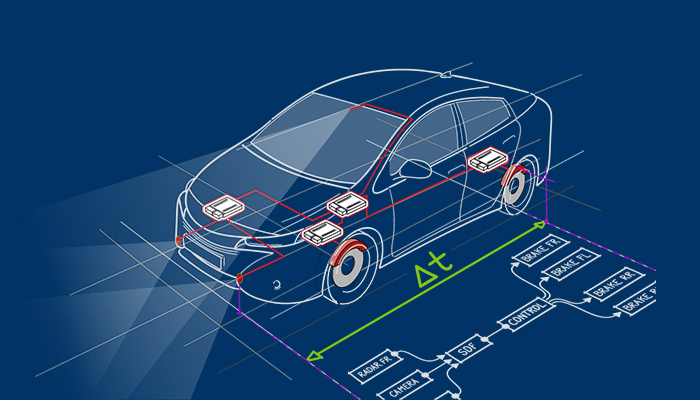
Visualize and analyze the imported traces of embedded systems and software. Verify timing requirements, quickly identify issues, and create test reports.

Scalable Visualization and Analysis of Traces
The tool offers a highly scalable solution for the visualization and statistical analysis of large hardware traces. It supports the import of data generated by instrumented code, debuggers, tracing tools, and proprietary solutions.
It enables integration and test engineers to view and analyze recorded data from many different perspectives. Its automated verification of requirements, in combination with interactive diagrams, contributes to a better understanding of the overall system behavior and the root causes of real-time errors.
Key Features
- Visualization and interactive exploration of recorded trace data
- Statistical analysis of timing and performance metrics
- Definition and automated verification of requirements
- Support of common tracing standards
- Import assistant for proprietary trace formats
- Generation of result reports
- Workflow automation (Python, Batch / CLI, REST API)
