- BlueBox
- On-Chip Software Debugging
BlueBox
On-Chip Analyzers Debug and Trace
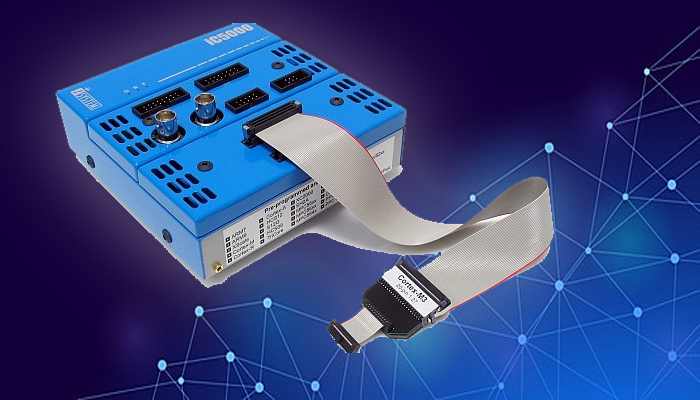
If you are in need of an embedded software development platform that does more, much more, than just debugging, then our family of BlueBox Debug and Trace tools is the hardware you are looking for. Fully integrated into our IDE, these hardware tools provide the link between your chosen microcontroller platform’s on-chip debug implementation and your development PC.
 |
|
|
|
|---|---|---|---|
| iC5700 | iC5000 | iC6000 | |
| PC Interface | USB 3.0 Ethernet |
USB 2.0 Ethernet |
USB 3.0 Ethernet |
| Trace Support | Nexus, ETM, HSSTP, AGBT, Aurora | Nexus, ETM | Aurora |
| Trace Buffer Size | 1 GB | 256 MB | 8 GB |
| Trace Bandwidth | up to 250 MHz in parallel mode up to 5 Gbps in serial mode |
up to 216 MHz | up to 15 Gbps |
| FNet Interface | |||
| Active Probe | |||
| I/O Module | |||
| Network Trace | |||
| Supported Processor Architectures |
|
|
|
Naturally, all these devices support the basic debug features that enable the programming of on and off-chip flash memories, execution of code and analysis of the status of variables, program state and RTOS tasks. Where they come into their own is with their advanced program and data trace features coupled with analog and digital signal capture. This makes it possible to analyze digital serial protocol data in parallel with RTOS task execution, brushless DC motor voltage or current consumption compared to algorithm results or even power consumption of your battery-powered IoT device in its various power-saving modes
On-Chip Software Debugging
The IDE, Debug & Trace tool delivers the insights every embedded development engineer needs, from the occasional user right through to the power developer.
- Import source code
- Edit, build and flash embedded software
- Display code execution
- Watch the variables in real time
- Capture and visualize program and data trace
- Get an insight into an AUTOSAR application
- Correlate microcontroller activity with network messages and signals
- Automate and optimize with scripting
What if there was a way to run automated unit, integration and system tests directly on your code base from a continuous integrated environment?
There is a way with our Software Test Tool!
Everything about Software Test Tool is tuned to make it easy to integrate a testing stage into your software development process. You can test your code with no instrumentation, perform real-time testing executed on a real target hardware and automate everything with scripting.
- Start testing quickly with a user-friendly GUI
- Execute tests on a real hardware without code instrumentation
- Perform unit, integration and system tests
- Build flexible test environments with Python scripts
- Automate testing using free iSYSTEM APIs